|
● Words from Editor
● The Processing Method of the Evaluation Indicators and Data of Kindergartens, Primary and Secondary Schools and International Schools in Hong Kong, China and the World in Education Competitiveness ● The realistic index system of assessment in education competitiveness ● The Calculation Method of Education Competitiveness Assessment of Kindergartens, Primary and Secondary Schools in Hong Kong and International Schools in Hong Kong, China and the World (How to Evaluate School Climate, Academic Achievements and Extra-Curricular Activities?) ● Collection and Processing of Index Data ● The processing of evaluation data ● Words from Editor
The Assessment series is designed to provide systematic information on the effectiveness of school education in Hong Kong. The script method is as follows:
1. Collect information from various sources to form all sorts of educational indicators in the Assessment.
2. The educational indicators in the Assessment are selected from the internationally applicable sections of the Statistical Yearbook of the United Nations Educational, Scientific and Cultural Organization.
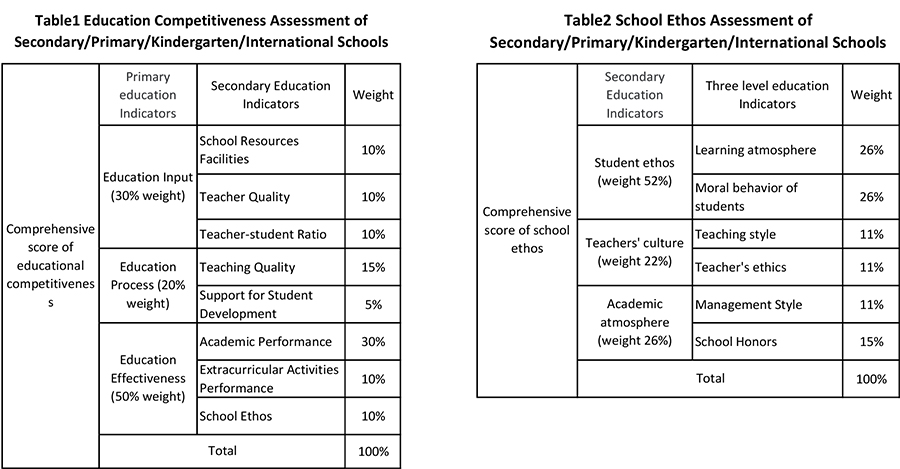
3. Refer to the 63 Level 2 and Level 3 indicators in the 2001 report of the Hong Kong Education Bureau on the educational performance of Hong Kong schools, including teacher quality, teacher-student ratio and teaching quality, school resources and facilities, academic performance, extra-curricular performance, student support measures, teacher job satisfaction, average teacher attritions over the past three years, teaching language, teaching mode, school history, average percentage of E grade or above in the past five college entrance examinations and per capita excellent rate, average percentage of 14 points in 6 subjects in the past five HKCEE, qualified rate in Chinese and English, per capita excellent rate, results of the last five DSE Diplomas and the final year (the enrollment rate of JUPAS, the number and percentage of students admitted to HKU/CUHK/HKUST each year, 5**, 5*, 5 or above excellent rate, excellent rate of grade 4 or above and excellent results per capita,33222 percentage of university entrance criteria, pass rate of grade 3 and 2 or above), primary school to middle school allocation results (number and ratio of secondary schools in Band 1, Band 2 & Band 3), results of kindergarten placement into primary school (number and ratio of primary schools promoted to Band 1, Band 2 & Band 3), final IB course results (the number and percentage of students with IB45/40/35 or above respectively), the number and percentage of students admitted to the top 10/20/30/50/100 universities in the world each year, Hong Kong subject test results before entry to FORM 1, territory-wide System Assessment Results (Form 3), students' participation in inter-school and inter-port sports competitions, students participate in school music, drama, recitation and dance festivals, students' participation in social and voluntary services, learning atmosphere, students' moral behavior, teaching style, teachers' ethics, school management style, school honor, etc.
Indicators selection and concept description
It must be selected according to established criteria. Four specific criteria are as follows:
1. Provide sufficient evidence to be easily understood by users at all levels, and try to avoid using composite or complex indicators;
2. Withstand time and help decision-makers make reasonable predictions about future results;
3. Measure lasting characteristics in school education and help focus future direction;
4. Help describe the current operation and effectiveness of school education;
Educational indicators do not provide an exhaustive picture of the effectiveness of school education but only a "snapshot" of the current situation. Therefore, a set of indicators needs to be developed to give a comprehensive picture of the effectiveness of a particular school. The indicators need to be linked together logically in order to present the overall picture, and the linking method should be based on a model and framework that illustrates the overall functioning of school education.
There is considerable literature on conceptual models or methods for developing educational indicators. For example, Averch et al. (1971) proposed five methods for studying educational indicators: Input/output method, process method, organization method, evaluation method and experimental method, Baker (1978) proposed the consumption and production pattern of educational indicators, Yamamoto (1987) proposed induction method, Meuret (1987) advocated the use of composite indicators, and so on.
The significance and value of the Assessment There is a widespread expectation that numbers will reflect the state of Hong Kong's education as people believe that numbers speak louder than arguments. However, numbers are valuable but not omnipotent. Numbers are abstractions, at the cost of a certain amount of information loss; Digital processing must be based on certain assumptions, which are at the cost of "ignoring objective concreteness" to some extent. Judging by numbers must be based on certain logic of causality which is affected by subjectivity to some extent. The Assessment is also influenced by subjective factors. That is, it is impossible for any indicator of competitiveness to be 100% objective. As long as scientific principles and scientific methods are applied, numbers and numerical analysis can be infinitely close to objectivity and illustrate the educational situation in various schools by numbers.
The value of numbers is not in itself, but in its application. We should recognize and respect numbers, but not blindly worship numbers and lose our judgment in front of them. In the Assessment we designed, its data must be quantifiable and traceable. However, the final score is not a judgment on the overall strength and weakness of each school. The Assessment will achieve its maximum value if all schools, especially excellent ones, can view it with an open-minded and self-examination attitude. It is hoped that it will become a repository of shared digital resources with sustainable value, providing a reference guide for parents choosing schools and educators. ●The Processing Method of the Evaluation Indicators and Data of Kindergartens, Primary and Secondary Schools and International Schools in Hong Kong, China and the World in Education Competitiveness The evaluation indexes are divided into two categories. One is the index that can be directly measured; the other is the factors that are difficult to measure directly, such as learning atmosphere, teaching philosophy, management level, a school’s popularity and so on. Among them, the factors that cannot be directly quantified can be reflected by indirect indicators, which are generally conducted through various forms of questionnaires in the schools in Hong Kong. The fact is that some factors of education competitiveness can be directly quantified, while some can only be indirectly quantified. From the perspective of evaluation purposes, evaluation indexes should be comprehensive and the number of indicators should be controlled. It is hoped that the results of school education competitiveness can be basically reflected through an appropriate number of evaluation indexes, as simple and straightforward as possible.
Education competitiveness is characterized by inherence (even the influence of external relations or environment on school education competitiveness is also affected by the internal factors of a school) and comprehensiveness. To evaluate education competitiveness of a school is to make its intrinsic property as visible as possible. It is necessary to analyze comprehensive property and to try to index it, so as to make it measurable.
The Realistic Index System of the Assessment of School Education Competitiveness Generally speaking, the index system should be as complete as possible. However, considering the importance of evaluation indicators and the difficulty of obtaining the supporting materials, there is no need to calculate all the data of indicators before evaluation. Instead, the number of indicators can be appropriately integrated and summarized according to the actual situation to facilitate understanding and operation. However, the premise is that the integrated index system can accurately and comprehensively reflect the education competitiveness of a school. Therefore, the following 63 analytical indicators are integrated into direct measurement data and indirect measurement data. The former is summarized into education input (school resources and facilities, teacher quality and teacher-student ratio), education process (teaching quality, support for student development) and education effectiveness (academic performance and extracurricular activities performance). The latter can be summarized into school climate, as shown in Table 1, Table 2 and Table4.
Education input describes the education competitiveness of a school in terms of absolute quantity. Generally speaking, the greater a school inputs, the stronger its competitiveness will be. Education process describes it in terms of relative quantity. The scale of a school increases, and the education competitiveness reflected by the educational process sub factors may not be enhanced. Education input and education process describe the static competitiveness of a school, while education effectiveness reflects the dynamic potential.
The Calculation Method of Education Competitiveness Assessment of Kindergartens, Primary and Secondary Schools in Hong Kong and International Schools in Hong Kong, China and the World (How to Evaluate School Climate, Academic Achievements and Extra-Curricular Activities?)
The three sub-indicators of school climate which are student ethos, teachers’ culture and school academic atmosphere can be further divided into learning atmosphere, students' moral behavior, teaching style, teachers' ethics, school management style and school honor to ensure the authenticity and reliability of the questionnaire. That is to design a questionnaire which involves three parts, namely, students' atmosphere, teachers' atmosphere, and school's academic atmosphere. The survey results are mainly used as monitoring data for mutual reference. Ai: student ethos
Academic achievements: the academic achievements of high schools and secondary schools are obtained from the result of current and the last five year DSE diploma examinations, the average scores of the past five College Entrance Examinations and the past five HKCEE examinations. The results of current DSE diploma examination include the university admission rate of JUPAS, the number and percentage of students admitted to the three major universities (HKU / CUHK / HKUST) each year, the excellent rate of grade 5 *, 5 *, grade 5 or above, the excellent rate of grade 4 or above and the per capita excellent results, the percentage of 33222 university entrance criteria, the pass rate of grade 3 and grade 2 or above, and the average results of the past five college entrance examinations include the rate of admission to local universities, the per capita excellent results, the pass rate of Chinese and English and the overall pass rate, the average scores of the past five HKCEE include the percentage of 14 points in the past five years in six subjects, the average excellent rate of each subject, the excellent rate per capita and the number of top-notch students, the scores of the current year's IB courses (the number and percentage of students who have obtained IB 45 points / 40 points / 35 points respectively), the number and percentage of students admitted to the top 10 / 20 / 30 / 50 / 100 universities in the world each year. The three-level education indicators described above constitute the academic achievement indicators (secondary education indicators) of this evaluation system. The calculation method of kindergarten academic achievement is the same as that of primary school academic achievement. The more students sent to band 1 elementary schools, the higher the score was. Extra-Curricular performance is calculated by multiplying the scores obtained by participating in the regional / local / national / international competitions listed in the annual school affairs report of the year by the relevant weights. The champion, runner up, second runner up or the top three in the national / international competition are 9 / 8 / 7 points, the top three in the territory are 6 / 5 / 4 points, and the top three in the region are 3 / 2 / 1 points. Finally, according to the highest score of each group in the year divided by 6, the average score is divided into 6 levels, and the score of the school is calculated. 6 points are the highest level, and 1 point is the lowest level. The level score is the performance score of the school's extra-curricular activities in the year.
● Collection and Processing of Index Data Index data are mainly collected through the school’s development plans, annual reports, inspection reports of the Education Bureau and external evaluation reports. The information provided by various media websites and forums is only for reference. The results of the questionnaire conducted in the whole HK by HKPEP for this event are mainly used as monitoring data for mutual reference. Since the annual report of Hong Kong schools is not officially released until around November of the following year, the level of educational competitiveness of schools in that year is determined by the calculation of the performance data of the previous year.
In addition, the other 15% of schools that did not publicly disclose data will be explained in detail. Indicators are often inconsistent due to different data sources. Data processing methods are designed for the evaluation of school education competitiveness:
The inverse index (denoted as x, whose n sample values are xi,...xn) is converted to a positive index, and the optional transformation is (x' represents the transformed index):
● The processing of evaluation data First, each index of the school is standardized, and the original data after standardized processing is called the index standard value. After multiplying the standard values of each index and the index weights, the standard values of factors can be obtained. The standard value of educational competitiveness can be obtained by multiplying the standard value of factors and adding the weight of factors. Standardized processing of data is carried out as follows:
Most of the 63 evaluation indexes involved in this report can be directly measured by the value of the index, but qualitative indexes need to be quantified by some method. Some evaluation elements need to be combined by several qualitative or quantitative indicators in accordance with a certain calculation model to obtain quantitative measure value. In order to avoid the errors caused by subjective judgment, semantic differential membership assignment method can be adopted. The qualitative indicators were divided into 1 ~ 7 rating (excellent, very good, good, fair, poor, very poor, terrible), and specific requirements were put forward for the indicators reflected in each rating, and the corresponding relationship between each rating and membership degree was established. According to the trend degree of index content, the evaluation value of each rating index varies from 7 to 1 points: (Excellent) corresponding index evaluation value is 7 points; (very good) 6; (good) 5; (fair) 4; (poor) 3; (very poor) 2; (terrible) 1.Specific measurement methods include:
3). According to the fact that the school whether obtain (or own) a certain resource, give "1" and "0" respectively for quantification, and divide the sum of school sample scores by the total number of samples to be the measurement value of the indicator.
4). According to the fact that whether a manager chooses a certain strategy or viewpoint, give "1" and "0" respectively to quantify. The sum of school sample scores divided by the total number of samples is the measurement value of this indicator.
According to the different functions of evaluation items, quantitative indicators can be divided into positive indicators (the larger the value is, the better), inverse indicators (the smaller the value is, the better) and moderate indicators (the moderate value is, the better). Most of the indicators used in this evaluation are positive (C241/C242/C251/C262/C323/C331/C332/C334/C336/C377/C341/C353). In the formula, the maximum value, minimum value and average value of the scoring system applicable to the quantitative index are taken as the standards for dimensionless processing. The original value of quantitative indicators is converted into the average value of indicators, and the corresponding models are as follows:
1). Fuzzy quantitative model of positive index number
2). Moderate index fuzzy quantization model
where
According to the above formula, the quantitative index value is between 0 and 5 points. When Rij< L, Rij=1. When 1≤Rij ≤5, the actual value is taken. In this way, after calculation, the evaluation value of each index becomes the same metric index, and the balance and coordination among each index are achieved.
3. The weight of evaluation index determined by judgment matrix
Pairwise comparison method can be adopted for the importance of the two indicators' contribution to the target. The equal ones are 5/5; relatively strong take 6/4; the strong pair is 7/3; The relatively strong one is 8/2; Absolutely strong, 9/1. The rest between the two are 5.5/4.5; 6.5/3.5; 7.5/2.5; 8.5/1.5 etc. respectively. Using the above scales as elements of the matrix, the judgment matrix of the indexes to be compared at each level is listed, such as the judgment matrix composed of the indexes to be compared at a certain level. The maximum characteristic root λmax and the corresponding normalized eigenvectors are obtained from the eigenvectors of the judgment matrix, namely, get the weight of each indicator at their respective levels (hierarchical single ranking).
The weight of each level element to the overall goal (educational competitiveness) (i.e. the overall ranking of levels) is the relative weight, which can be obtained through the following steps. Let the k-1 layer have m elements C1, C2...Cm to any element Ci, the relative weight of its corresponding element at the k-layer is: The combined weight of the index of m elements in the upper layer is
The weights of all elements at each level to the overall goal can be found:
Where h is the layer of the whole system
According to the above methods of quantification of qualitative indicators, dimensionless treatment of quantitative indicators and determination of hierarchical ranking weights, the calculation formula of school comprehensive evaluation value can be finally obtained: C=ΣRijAij
After obtaining the quantitative results of the evaluation of educational competitiveness, the validity of the evaluation results is analyzed by non-parametric statistical method. Namely, Kendall check, sum-rank-order bidirectional variance test is used to identify consistency problems. The validity is tested from the consistency of expert evaluation and self-evaluation results.
Where, K-number of evaluation levels (The evaluation of educational competitiveness is generally carried out by combining expert evaluation with self-evaluation, so K=2)
Calculate
If KN≥x2(N-1), the evaluation results can be considered consistent; otherwise, the results are inconsistent. In this way, the rationality and consistency of the evaluation results of each school's educational competitiveness can be analyzed, so as to test the validity of the results.
Through the analysis of the above different elements, deconstruct the competitiveness of education, analytic Hierarchy Process (AHP), fuzzy comprehensive evaluation, Non-parametric statistics and other methods are used comprehensively to make a preliminary discussion on the evaluation of the competitiveness of school education, and put forward the model of evaluation. From the three aspects of educational input, educational process and educational effect, the paper evaluates the educational competitiveness from potential ability, dynamic process and competitive effect, reflecting the competitiveness of the evaluation items comprehensively.
|
||||||||||||||||||||||||||||||||||||||||||||||||||||||||||||||||||||||||||||||||||||||||||||||||||||||
Copyright © Hong Kong Professional Education Press(HKPEP)_Educational Information Institute hkpep.top All Rights Reserved |

 ,the number of j elements in the k-1 layer